
How do you track the performance of your marketing efforts?
If your answer to that question is solely “Asking customers how they heard about us”, you are missing out on data that could change the way you strategize completely. The unfortunate truth is that customers don’t recall where they heard about you and say whatever comes to mind. As mentioned in a previous blog, we are exposed to between 4,000 and 10,000 advertisements a day! While effective marketing keeps your brand at top of mind when it comes time to make a purchase, it’s often cloudy where they saw your ad last. During a customer study for an automotive client, nearly 15% of customers said they saw their commercial on TV and the client had not run a television advertisement in over 6 months! While it is possible they saw the ad 6 months ago and remembered them when they were ready to buy, it’s likely not what got them in the door the day they decided.
If you are not currently tracking your marketing efforts by utilizing website tracking tools, you should be. As a business, you need to know exactly what is working for you and what is not when it comes to your marketing! There are several methods to tracking your website data; we recommend Google Analytics, especially if you currently use or plan to use other google marketing products such as Google Ads, previously known as Adwords. Analytics can link with your Google Ads account and allow you to better understand the quality of the traffic being driven by your marketing efforts. If you are not familiar with Google Analytics, it is a free tool that is super easy to utilize. Simply have your website manager add a google tracking code to the header of your website and dive into the data.
While Google Analytics is an “easy to use tool”, it can take some getting used to. Knowing what to look for and where to find it will make your life much easier! We’ve put together some tips to help ensure your account is properly set up and gets you the data you need as quickly as possible.
Custom Dashboards
There is a dashboard section under “Customization” within your Google Analytics account that allows you to create custom dashboards. These dashboard will compile data in the form of widgets that allow you to quickly visualize your data. If you don’t feel comfortable setting up your own, there are also free collections that you can download straight into your account. Custom dashboards will keep all the information important to you in one place within your account.
UTM Tracking codes
A UTM code is a unique identifier that can be added to your existing URL in order to track a source, medium and campaign name. This lets Google Analytics tell you exactly what traffic came from what campaign and what users did once they got to your website. Say you run an email Marketing campaign. If you use UTM codes for every link within that email, the data will show up under Acquisitions>Campaigns>All Campaigns within your analytics account. After the campaign is over, you will know exactly how many users came to your website from the email, if they stayed on your website or not (Bounce Rate), how long they stayed on your website, if they purchased anything, and the revenue tied to that purchase. This will give you an exact numerical value that you gained immediately from that email blast and allow you to determine if you received a positive return on investment. This method is a bit more difficult for some traditional media like TV, Billboards, and Radio, but can be requested from digital media companies managing your marketing efforts to measure results.
Custom Reporting
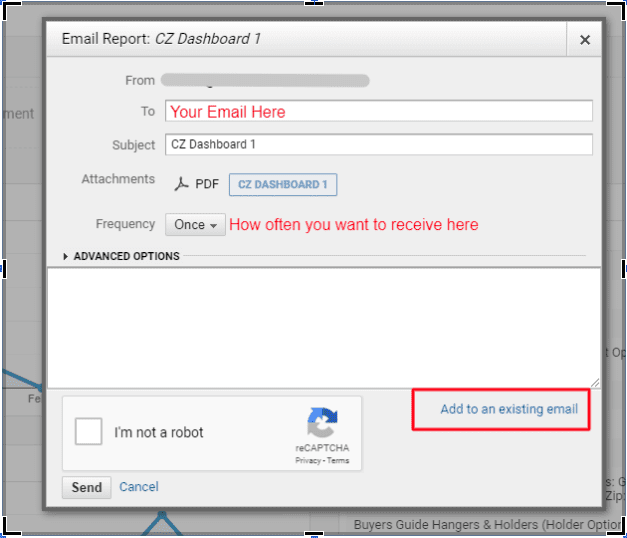
Google Analytics allows you to set up automated reporting. If you are not the type to dig into your analytics account on a weekly or even monthly basis, but are interested in the data, you can have a report with all the information you need emailed to you as often as you would like. To set up a custom automated report, you simply will log into your analytics account, go to a section you would like sent to you, and click on the “Email” button as seen in the screenshot below.

You then fill out the information in the pop up box with your email, frequency you want to receive the report, and any other custom fields you feel apply to you. If you have already created an email and simply want to add a section to a report, you would click on the “Add to existing email” button in the bottom right corner and select the email to attach it too.
These are three small tips to help you receive and interpret data more efficiently within your Google Analytics account. We also recommend that you set up IP Filters to remove internal traffic from data that could skew your traffic numbers, be sure to set up conversion goals that make sense for your business model and link your analytics account with google ads account so you can properly see how effective your efforts are working. If you would like more information or would prefer to have someone set all of this up for you, we would be happy to help! Contact us for a free overview.